Determine if a range of values is linear

Just starting out? Need help? Post your questions and find answers here.
User avatar
Keya
Addict
Addict
Posts: 1890
Joined: Thu Jun 04, 2015 7:10 am

Determine if a range of values is linear

Post by Keya »

I was playing around with Lunasole's graph and it made me wonder: how do you determine how linear a range of values is? Where for example 0.0 is perfectly linear (2,4,6,8,10 or 10,8,6,4,2 or 5,5,5,5,5 etc) and 1.0 is 'extreme sawtooth' (255,0,255,0,255).
But then there's ones like 2,4,8,10,8,4,2 in a "/\" shape ... = 0.5 maybe?!?
I've come up with a couple of methods which are in the ballpark but clearly missing the mark!
does anyone know of any ways? sad to say my googling for this was fruitless

Code: Select all

Procedure.d Linearity(*buf.Ascii, len)
  Protected totdev.d, max.d, expdev.d, *p.Ascii = *buf, exp.d
  min = 255+1:  minpos=1
  For i = 1 To len
    If *p\a > max: max = *p\a: maxpos=i: EndIf
    If *p\a < min: min = *p\a: minpos=i: EndIf
    *p+1
  Next i  
  If maxpos => minpos: direction=1: Else: direction=-1: EndIf  
  expdev.d = ((max-min) / (len-1)) * direction  
  If direction = -1: exp=max: Else: exp=min: EndIf
  *p = *buf
  For i = 1 To len ;+ 1
    totdev + Abs(exp - *p\a)
    ;Debug Str(i) + " Expected " + exp + " but actually " + Str(*p\a) + ", diff=" + Str(Abs(exp - *p\a))
    exp + expdev
    *p+1
  Next i  
  ProcedureReturn totdev/len
EndProcedure


Procedure.d Linearity2(*buf.Ascii, len)
  Protected totdev.d, max.d, expdev.d, *p.Ascii = *buf, exp.d  
  *p = *buf
  For i = 1 To len ;+ 1    
    delta = *p\a - lastdelta    
    deltadiff = Abs(lastdelta - delta)
    totdev + deltadiff    
    lastdelta = delta
    *p+1
  Next i  
  ProcedureReturn totdev/len
EndProcedure

#NUMVALS=10
Debug Linearity(?X1, #NUMVALS)
Debug Linearity(?X2, #NUMVALS)
Debug Linearity(?X3, #NUMVALS)
Debug Linearity(?X4, #NUMVALS)
Debug Linearity(?X5, #NUMVALS)
Debug Linearity(?X6, #NUMVALS)

DataSection
X1:
Data.a 0,255,0,255,0,255,0,255,0,255 ;= "0.0"

X2:
Data.a 2,4,6,8,10,12,14,16,18,20 ;= "1.0"

X3:
Data.a 20,18,16,14,12,10,8,6,4,2 ;= "1.0"

X4:
Data.a 2,4,6,8,10,11,12,16,18,20 ;= ?

X5:
Data.a 2,4,6,8,10,17,17,16,18,20 ;= ?

X6:
Data.a 2,4,6,8,10,10,8,6,4,2      ;= ~0.5?

EndDataSection
User avatar
Kukulkan
Addict
Addict
Posts: 1396
Joined: Mon Jun 06, 2005 2:35 pm
Location: germany
Contact:

Re: Determine if a range of values is linear

Post by Kukulkan »

Maybe you can do a FFT to find any frequent repetitions? If no frequency is found in enough relevancy, no repetition is given in the data.

https://en.wikipedia.org/wiki/Fast_Fourier_transform
said
Enthusiast
Enthusiast
Posts: 342
Joined: Thu Apr 14, 2011 6:07 pm

Re: Determine if a range of values is linear

Post by said »

You can do a linear regression and see the correlation coefficient (really simple stuff), you can look here for example:

https://mathbits.com/MathBits/TISection ... linear.htm


edit, here is a real code (hope this helps :lol: ) using correlation coefficient:

Code: Select all

EnableExplicit

Procedure.d Linearity3(*buf.Ascii, n)
    Protected i, *p.Ascii
    Protected.d x, y, avg_x, avg_y, sum_x, sum_y, sum_x2, sum_y2, prd_xy, coef_r
    
    *p = *buf
    For i = 1 To n
        x = i
        y = *p\a
        sum_x + x
        sum_y + y
        sum_x2 + (x*x)
        sum_y2 + (y*y)
        prd_xy + (x*y)
        
        *p+1
    Next
    
    coef_r = ( (n*prd_xy) - (sum_x*sum_y) ) / ( Sqr( n*sum_x2 - (sum_x*sum_x) ) * Sqr( n*sum_y2 - (sum_y*sum_y) ))
    
    ProcedureReturn coef_r
EndProcedure

#NUMVALS=10
; Debug Linearity(?X1, #NUMVALS)
; Debug Linearity(?X2, #NUMVALS)
; Debug Linearity(?X3, #NUMVALS)
; Debug Linearity(?X4, #NUMVALS)
; Debug Linearity(?X5, #NUMVALS)
; Debug Linearity(?X6, #NUMVALS)
Debug "================ said"
Debug Linearity3(?X1, #NUMVALS)
Debug Linearity3(?X2, #NUMVALS)
Debug Linearity3(?X3, #NUMVALS)
Debug Linearity3(?X4, #NUMVALS)
Debug Linearity3(?X5, #NUMVALS)
Debug Linearity3(?X6, #NUMVALS)

DataSection
X1:
Data.a 0,255,0,255,0,255,0,255,0,255 ;= "0.0"

X2:
Data.a 2,4,6,8,10,12,14,16,18,20 ;= "1.0"

X3:
Data.a 20,18,16,14,12,10,8,6,4,2 ;= "1.0"

X4:
Data.a 2,4,6,8,10,11,12,16,18,20 ;= ?

X5:
Data.a 2,4,6,8,10,17,17,16,18,20 ;= ?

X6:
Data.a 2,4,6,8,10,10,8,6,4,2      ;= ~0.5?

EndDataSection
User avatar
Keya
Addict
Addict
Posts: 1890
Joined: Thu Jun 04, 2015 7:10 am

Re: Determine if a range of values is linear

Post by Keya »

AWESOME!!! I wasn't familiar with linear regression (did i learn this at school!? can't remember - but that doesn't mean i wasn't taught it! haha)
that's giving really good values too, so from that yes I think linear regression is definitely what i'm after. I went googling after you first mentioned it but didn't get too far, lots of theory and i still wasn't 100% sure if it was what i was after, so thankyou very very much for the smoking gun code example!! the algorithm is a nice addition to some of the statistical ones here too :)
said
Enthusiast
Enthusiast
Posts: 342
Joined: Thu Apr 14, 2011 6:07 pm

Re: Determine if a range of values is linear

Post by said »

haha :D to my knowledge linear regression is taught at first/second year at univ (i could be wrong); Not always obvious to make the link between real life problems and what we have been taught :D
you are welcome, for the sake of completeness, above routine is to calculate correlation coefficient (without passing by linear regression ... they are both built using pretty much the same calculations) in that specific case the corr.coeff is more than enough (the added value of a linear regression is the ability to predict the Y for future or unknown X (x being the index i in that proc)

I noticed your other contribution about stats routines and thank you for that (and other nice contributions as well) :)

Said
User avatar
Keya
Addict
Addict
Posts: 1890
Joined: Thu Jun 04, 2015 7:10 am

Re: Determine if a range of values is linear

Post by Keya »

so would you just call it Correlation or ...?
Here's my version of what i thought is 'standard Correlation' but im not sure

Code: Select all

File1.s = "c:\file1.dat"
File2.s = "c:\file2.dat"

ReadFile(0,File1, #PB_File_SharedRead | #PB_File_SharedWrite)
flen = Lof(0)
*bufA.Ascii = AllocateMemory(flen)
ReadData(0,*bufA, flen)
CloseFile(0)

ReadFile(0,File2, #PB_File_SharedRead | #PB_File_SharedWrite)
*bufB.Ascii = AllocateMemory(flen)
ReadData(0,*bufB, flen)
CloseFile(0)

Define i, ft.f, fCor.f
For i = 0 To flen-1
  ft = Sqr(Abs(Pow(*bufA\a,2) - Pow(*bufB\a,2)))
  ft / 255.0
  ft = 1.0 - ft
  fCor + ft  
  *bufA + 1: *bufB + 1
Next i
fCor / flen
Debug ";Correlation=" + StrF(fCor) 
said
Enthusiast
Enthusiast
Posts: 342
Joined: Thu Apr 14, 2011 6:07 pm

Re: Determine if a range of values is linear

Post by said »

Keya wrote:so would you just call it Correlation or ...?
We can give any name to that procedure but it does calculate the 'Correlation Coefficient' this is a well defined term is stats (other name of the same entity is Pearson coefficient) :D
Keya wrote: Here's my version of what i thought is 'standard Correlation' but im not sure ...
Never heard of this term before, there are many correlation indicators and what you define is certainly a dispersion indicator, if you find it suitable then why not using it :) but for your problem, the correlation coefficient would be hard to beat 8)
User avatar
Keya
Addict
Addict
Posts: 1890
Joined: Thu Jun 04, 2015 7:10 am

Re: Determine if a range of values is linear

Post by Keya »

said wrote:
Keya wrote:so would you just call it Correlation or ...?
We can give any name to that procedure but it does calculate the 'Correlation Coefficient' this is a well defined term is stats (other name of the same entity is Pearson coefficient) :D
AHHHAH! Pearson's kept popping up time and time again when googling for stats algos (very useful it seems) so it's great to finally know i've got access to it - thankyou again!!! a pretty sweet addition to the toolbox hehe.
https://en.wikipedia.org/wiki/Pearson_c ... oefficient
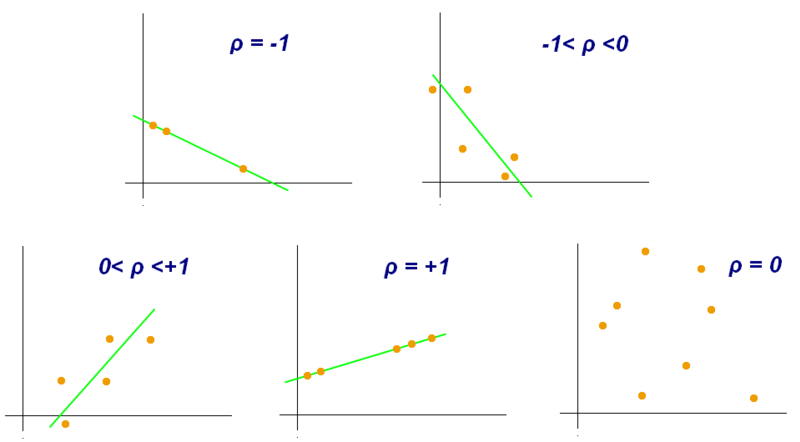
An image from that wiki page...
Image
^^^ YES, THIS!! That's what i need to do!!! lol
Post Reply