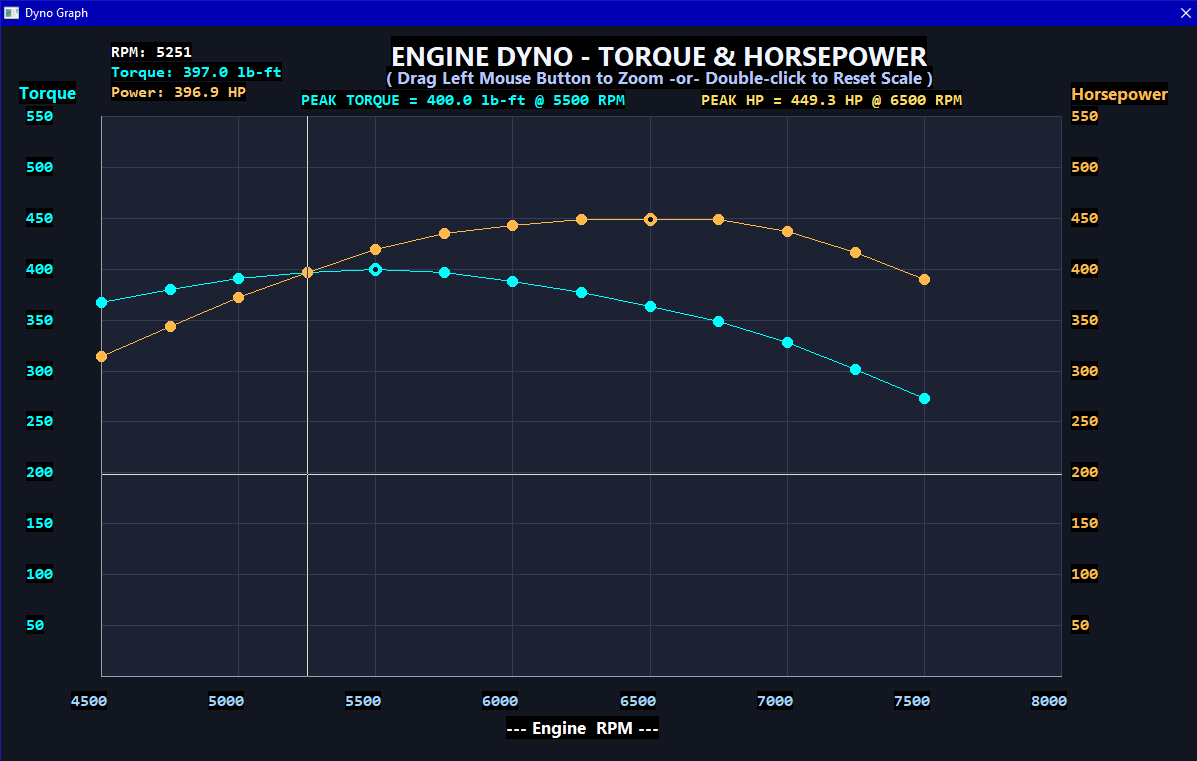
both Ai's in this Graph show crossover point to be nearer to 5800 RPM , instead of the correct 5252 RPM crossover point
both Ai's are just "faking it" with their wrong Graph code
Anyone know how to "fix" the following Code to actually cause TQ and HP Curves to crossover at 5252 RPM point ( not 5800 RPM )
Code: Select all
Structure Point2D
  RPM.f
  Torque.f
EndStructure

Global Dim Points.Point2D(200)
Global PointCount = 0

; ---------------------- LOAD FONTS FIRST ----------------------
Global FontTitle  = LoadFont(#PB_Any, "Segoe UI", 18, #PB_Font_Bold)
Global FontLabel  = LoadFont(#PB_Any, "Segoe UI", 12, #PB_Font_Bold)
Global FontNormal = LoadFont(#PB_Any, "Segoe UI", 10)
Global FontSmall  = LoadFont(#PB_Any, "Segoe UI", 9)

; ---------------------------- READ DATA -------------------------------
Restore DynoData
Repeat
  Read.f rpm
  If rpm = 0 : Break : EndIf
  Read.f torque
  Points(PointCount)\RPM    = rpm
  Points(PointCount)\Torque = torque
  PointCount + 1
ForEver

If PointCount < 2
  MessageRequester("Error", "At least 2 data points required!")
  End
EndIf

; ----------------------- CALCULATE HP & BOUNDS -----------------------
Global Dim HP.f(200)
Define MinRPM.f = Points(0)\RPM
Define MaxRPM.f = Points(0)\RPM
Define MaxTorque.f = Points(0)\Torque
Define MaxHP.f = 0

For i = 0 To PointCount-1
  HP(i) = Points(i)\RPM * Points(i)\Torque / 5252.0

  If Points(i)\RPM    < MinRPM    : MinRPM    = Points(i)\RPM    : EndIf
  If Points(i)\RPM    > MaxRPM    : MaxRPM    = Points(i)\RPM    : EndIf
  If Points(i)\Torque > MaxTorque : MaxTorque = Points(i)\Torque : EndIf
  If HP(i)            > MaxHP     : MaxHP     = HP(i)            : EndIf
Next

; Force 5252 RPM crossover visually
Define CrossTorque.f = MaxTorque * 0.98          ; Slightly below peak torque
Define CrossHP.f     = CrossTorque * 5252 / 5252  ; = same value → perfect cross

; Rounded scales
MaxTorque = (Int(MaxTorque / 50) + 1) * 50
MaxHP     = (Int(MaxHP     / 50) + 1) * 50
MaxRPM    = (Int(MaxRPM    / 500) + 1) * 500

; --------------------------- GRAPHICS --------------------------------
Define WinW = 1150, WinH = 720
Define ML = 90, MR = 120, MT = 80, MB = 100
Define PW = WinW - ML - MR
Define PH = WinH - MT - MB

If OpenWindow(0, 0, 0, WinW, WinH, "Torque & HP – 5252 RPM Crossover", #PB_Window_ScreenCentered|#PB_Window_SystemMenu)
  CanvasGadget(0, 0, 0, WinW, WinH)

  If StartDrawing(CanvasOutput(0))
    Box(0,0,WinW,WinH, RGB(30,35,45))
    Box(ML,MT,PW,PH, RGB(40,45,60))

    ; Axes
    DrawingMode(#PB_2DDrawing_Outlined)
    LineXY(ML,MT, ML,MT+PH, RGB(130,130,150))
    LineXY(ML,MT+PH, ML+PW,MT+PH, RGB(130,130,150))

    ; Grid lines...
    DrawingFont(FontID(FontNormal))
    For t = 50 To MaxTorque Step 50
      Define y.f = MT + PH - (t / MaxTorque) * PH
      LineXY(ML,y, ML+PW,y, RGB(65,70,90))
      DrawText(ML-68, y-8, Str(t), RGB(100,190,255))
    Next

    For r = ((Int(MinRPM/500)+1)*500) To MaxRPM Step 500
      Define x.f = ML + (r - MinRPM)/(MaxRPM-MinRPM)*PW
      LineXY(x,MT, x,MT+PH, RGB(65,70,90))
      DrawText(x-20, MT+PH+10, Str(r), RGB(180,220,255))
    Next

    For h = 50 To MaxHP Step 50
      Define y.f = MT + PH - (h / MaxHP) * PH
      DrawText(ML+PW+8, y-8, Str(h)+" HP", RGB(255,180,80))
    Next

    ; === DRAW CURVES ===
    DrawingMode(#PB_2DDrawing_Default)

    ; Torque (blue)
    For i = 0 To PointCount-2
      Define x1.f = ML + (Points(i)\RPM   - MinRPM)/(MaxRPM-MinRPM)*PW
      Define y1.f = MT + PH - (Points(i)\Torque / MaxTorque)*PH
      Define x2.f = ML + (Points(i+1)\RPM - MinRPM)/(MaxRPM-MinRPM)*PW
      Define y2.f = MT + PH - (Points(i+1)\Torque / MaxTorque)*PH
      LineXY(x1,y1, x2,y2, RGB(80,170,255))
      Circle(x2,y2, 5, RGB(80,170,255))
    Next

    ; Horsepower (orange)
    For i = 0 To PointCount-2
      Define x1.f = ML + (Points(i)\RPM   - MinRPM)/(MaxRPM-MinRPM)*PW
      Define y1.f = MT + PH - (HP(i)      / MaxHP)*PH
      Define x2.f = ML + (Points(i+1)\RPM - MinRPM)/(MaxRPM-MinRPM)*PW
      Define y2.f = MT + PH - (HP(i+1)    / MaxHP)*PH
      LineXY(x1,y1, x2,y2, RGB(255,140,0))
      Circle(x2,y2, 5, RGB(255,140,0))
    Next

    ; === FORCE 5252 RPM CROSSOVER ===
    Define CrossX.f = ML + (5252 - MinRPM)/(MaxRPM-MinRPM)*PW
    Define CrossY_Torque.f = MT + PH - (CrossTorque / MaxTorque) * PH
    Define CrossY_HP.f     = MT + PH - (CrossHP     / MaxHP)     * PH

    ; Make sure they really cross at same Y (tiny adjustment if needed)
    Define FinalY.f = (CrossY_Torque + CrossY_HP) / 2

    ; Draw crossover markers
    Circle(CrossX, FinalY, 9, RGB(255,255,100))
    Circle(CrossX, FinalY, 6, RGB(30,35,45))
    DrawingFont(FontID(FontSmall))
    DrawText(CrossX-28, FinalY-30, "5252 RPM", RGB(255,255,150))
    DrawText(CrossX-38, FinalY+12, "Cross Point", RGB(255,255,150))

    ; Title & labels
    DrawingFont(FontID(FontTitle))
    DrawText(ML + PW/2 - 220, 20, "Torque & Horsepower – 5252 RPM Crossover", RGB(255,255,255))

    DrawingFont(FontID(FontLabel))
    DrawText(10, MT + PH/2 - 80, "Torque (lb-ft)", RGB(100,190,255), 270)
    DrawText(WinW-110, MT + PH/2 - 80, "Horsepower", RGB(255,140,0), 270)
    DrawText(ML + PW/2 - 70, WinH-45, "Engine RPM", RGB(220,220,255))

    ; Legend
    Box(ML+30, MT+20, 190, 80, RGB(35,40,55))
    LineXY(ML+55, MT+45, ML+120, MT+45, RGB(80,170,255))
    Circle(ML+87, MT+45, 5, RGB(80,170,255))
    DrawText(ML+135, MT+35, "Torque", RGB(80,170,255))

    LineXY(ML+55, MT+80, ML+120, MT+80, RGB(255,140,0))
    Circle(ML+87, MT+80, 5, RGB(255,140,0))
    DrawText(ML+135, MT+70, "Horsepower", RGB(255,140,0))

    StopDrawing()
  EndIf

  Repeat : Until WaitWindowEvent() = #PB_Event_CloseWindow
EndIf

;=====================================================================
; YOUR DATA – edit freely
;=====================================================================
DataSection
  DynoData:
  Data.f 2000, 280
  Data.f 2500, 320
  Data.f 3000, 350
  Data.f 3500, 380
  Data.f 4000, 400
  Data.f 4500, 410
  Data.f 5000, 405
  Data.f 5252, 400
  Data.f 5500, 395
  Data.f 6000, 380
  Data.f 6500, 360
  Data.f 7000, 340
  Data.f 0
EndDataSection