Hello at all
Exist it a tool in PB, who show the list of procedures called and the order where she are called ?
Have a good day
Tool for see the call of procedures
-
Kwai chang caine

- Always Here

- Posts: 5709
- Joined: Sun Nov 05, 2006 11:42 pm
- Location: Lyon - France


Re: Tool for see the call of procedures
Have you tried Debugger | Callstack ?
Just because it worked doesn't mean it works.
PureBasic 6.04 (x86) and <latest stable version and current alpha/beta> (x64) on Windows 11 Home. Now started with Linux (VM: Ubuntu 22.04).
PureBasic 6.04 (x86) and <latest stable version and current alpha/beta> (x64) on Windows 11 Home. Now started with Linux (VM: Ubuntu 22.04).
-
Kwai chang caine
- Always Here
- Posts: 5709
- Joined: Sun Nov 05, 2006 11:42 pm
- Location: Lyon - France
Re: Tool for see the call of procedures
Hello Axolotl 
Yes, i have try the tool CallStacks but not really understand
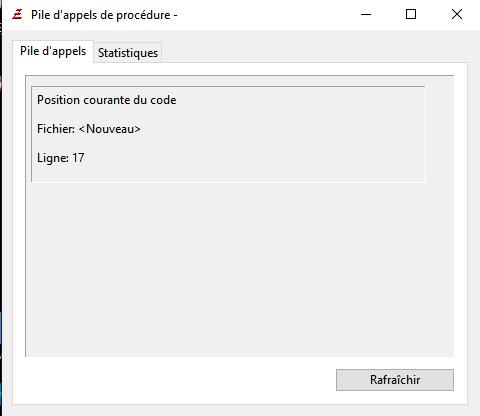
That only show some lines
Me... i search instead something who write this style of lines :
Yes, i have try the tool CallStacks but not really understand
That only show some lines
Me... i search instead something who write this style of lines :
for this codeKCC imaginary CallStack wrote:
Start => one()
One() => Two()
Two() => Tree()
Code: Select all
Procedure Three()
 Debug "Hello"
EndProcedure

Procedure Two()
 Three()
EndProcedure

Procedure one()

 Two()

EndProcedure

one()

Repeat : Delay(1) :Until GetAsyncKeyState_(#VK_ESCAPE)
Re: Tool for see the call of procedures
You could try something like this...
Code: Select all
;/ simple procedure profiling - PJ

#ProcProfile = #True
Global NewMap P_CallCount.i()
Global NewList P_Sequence.s()

Macro ProcProfileBegin
  CompilerIf #ProcProfile = #True
    P_CallCount(#PB_Compiler_Procedure) + 1
    AddElement(P_Sequence()) : P_Sequence() = #PB_Compiler_Procedure
  CompilerEndIf
EndMacro

Procedure Three() : ProcProfileBegin
 ;Debug "Hello"
EndProcedure

Procedure Two() : ProcProfileBegin
 Three()
EndProcedure

Procedure One() : ProcProfileBegin
 Two()
EndProcedure

One()

OpenConsole()
; output results:
ForEach P_Sequence()
  PrintN( "Procedure Call #"+Str(ListIndex(P_Sequence())+1)+": "+P_Sequence()+"()")
Next
PrintN("")
ForEach P_CallCount()
  PrintN("Called "+MapKey(P_CallCount())+"() "+P_CallCount()+" time(s).")
Next
PrintN("") : PrintN("Finished")
Input()
Re: Tool for see the call of procedures
Salut KCC,
I usually put after each Procedure X() a:
So, I can see the flow of procedure calls in debugging window.
I usually put after each Procedure X() a:
Code: Select all
Debug #PB_Compiler_Procedure+"(Here, with possibly detail of parameter values)",99 ; 99 to show/hide them with DebugLevelIf my English syntax and lexicon are incorrect, please bear with Google translate and DeepL. They rarely agree with each other!
Except on this sentence...
Except on this sentence...
-
Kwai chang caine
- Always Here
- Posts: 5709
- Joined: Sun Nov 05, 2006 11:42 pm
- Location: Lyon - France
Re: Tool for see the call of procedures
Hello at you two
Thanks a lot for your two tips
Apparently we are forced to modify the original code for put the "Flags"
Even if with the IDE "Replace" function that can be more easier, if the code is very big with several includefile, that can be a little bit fastidious
I'm surprising, because i thought FRED had planned this kind of useful tool in his splendid program
Especially since I believe that the precompiler is responsible for tracing the entire path that the program will take before each compilation, if I am not mistaken, which is exactly what I am trying to know.
Again thanks for your answers, i wish you a good day at you two
Re: Tool for see the call of procedures
Salut KCC,
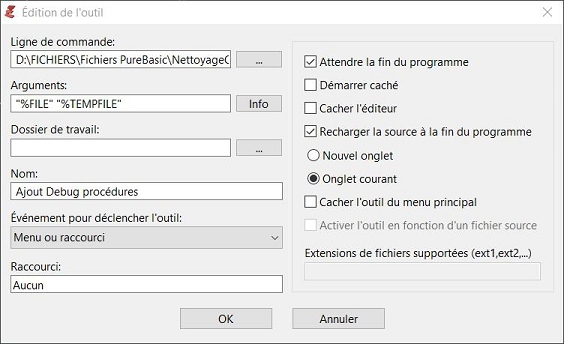
If needed, a very old dirty code to add "Debug #PB_Compiler_Debug" in codes.
It is intended for use as a PB-tool IDE and certainly needs to be improved.
EDIT : As you probably noticed, I wanted to write #PB_Compiler_Procedure instead of #PB_Compiler_Debug. 
EDIT 2: Sorry, I forgot to give the tool's config:
If needed, a very old dirty code to add "Debug #PB_Compiler_Debug" in codes.
It is intended for use as a PB-tool IDE and certainly needs to be improved.
Code: Select all
EnableExplicit

Define.s FichierSource,FichierCible,Chaine,ChaineDebug="Debug #PB_Compiler_Procedure"
Define.b Proc
If CountProgramParameters()<>2
  End
EndIf
FichierSource=ProgramParameter()
FichierCible=ProgramParameter()
If ReadFile(0,FichierSource,#PB_File_SharedRead)=0
  End
EndIf
If CreateFile(1,FichierCible)=0
  End
EndIf
While Not Eof(0)
  Chaine=ReadString(0)
  While Right(Chaine,1)=Chr(32) Or Right(Chaine,1)=Chr(9)
    Chaine=Left(Chaine,Len(Chaine)-1)
  Wend
  If (LCase(Left(Trim(ReplaceString(Chaine,Chr(9),"")),9))="procedure" Or LCase(Left(Trim(ReplaceString(Chaine,Chr(9),"")),12))="proceduredll" Or LCase(Left(Trim(ReplaceString(Chaine,Chr(9),"")),17))="runtime procedure") And LCase(Left(Trim(ReplaceString(Chaine,Chr(9),"")),15))<>"procedurereturn"
    Proc=#True
  Else
    If Proc And LCase(Left(Trim(ReplaceString(Chaine,Chr(9),"")),28))<>LCase(ChaineDebug)
      Chaine=Chr(9)+ChaineDebug+"+"+Chr(34)+"()"+Chr(34)+Chr(10)+Chaine
    EndIf
    Proc=#False
  EndIf
  WriteStringN(1,Chaine)
Wend
CloseFile(0)
CloseFile(1)
EDIT : As you probably noticed, I wanted to write #PB_Compiler_Procedure instead of #PB_Compiler_Debug.
EDIT 2: Sorry, I forgot to give the tool's config:
Last edited by boddhi on Sat Aug 03, 2024 9:42 am, edited 2 times in total.
If my English syntax and lexicon are incorrect, please bear with Google translate and DeepL. They rarely agree with each other!
Except on this sentence...
Except on this sentence...
Re: Tool for see the call of procedures
Code: Select all
Global order
Macro order(i)
	order+1
EndMacro

Procedure Three()
	order(i)
	Debug Str(order) + " => Three()"
	Debug "Hello"
EndProcedure

Procedure Two()
	order(i)
	Debug Str(order) + " => Two()"
	Three()
EndProcedure

Procedure one()
	order(i)
	Debug Str(order) + " => one()"
	Two()

EndProcedure

one()

Repeat : Delay(1) :Until GetAsyncKeyState_(#VK_ESCAPE)If you need to insert this into someone else's code, then use a regular expression
Find:
Code: Select all
(?mi)^(\h*(?:Procedure[CDL$]{0,5}?(?:\h*\.[abcdfilqsuw])?\h+\K)[A-Za-z_]\w*\h*\(.+)\r?$Code: Select all
\1\r\n\torder(i)-
Kwai chang caine
- Always Here
- Posts: 5709
- Joined: Sun Nov 05, 2006 11:42 pm
- Location: Lyon - France
Re: Tool for see the call of procedures
Thanks a lot at you two, i take a look to your tips