
example1:
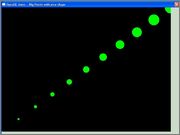
Big round Points with Nice shapes (no little spikes on the points boundary): search the word 'nice' for the related OpenGL beautifying functions
Code: Select all
Structure vertex
  x.f ; x position
  y.f
  z.f
  r.f ; red color
  g.f
  b.f
  a.f ; alpha

EndStructure

Global v1.vertex

Procedure drawPoint(*v1.vertex, point_size.f)
  ;draw a point with size, color, And location
	glPointSize_(point_size);
	glBegin_(#GL_POINTS);
	glColor4f_(*v1\r, *v1\g, *v1\b, *v1\a);
	glVertex3f_(*v1\x, *v1\y, *v1\z)      ;
	glEnd_();
EndProcedure

Procedure drawPointsDemo()
	size.f = 5 : x.f = -1 : y.f = -1
	  While x.f <=1
	    v1\x = x: v1\y= y : v1\z = 0
	    v1\r=0 : v1\g=1: v1\b =0 : v1\a = 1

	  drawPoint(@v1, size);
	                                 ;
		x+0.2
		y+0.2
		size + 5
		Wend
EndProcedure


Define event, quit

ExamineDesktops()
Global width.f = DesktopWidth(0)-40
Global height.f = DesktopHeight(0)-40

;OpenWindow(0, 0, 0, DesktopWidth(0), DesktopHeight(0), "OpenGL demo .. Big Points ", #PB_Window_BorderLess )
OpenWindow(0, 0, 0, DesktopWidth(0), DesktopHeight(0), "OpenGL demo .. Big Points with nice shape")
SetWindowColor(0, RGB(200,220,200))
OpenGLGadget(0, 0, 0, width , height, #PB_OpenGL_Keyboard )


Procedure Render()

 glViewport_(0, 0, width, height)

 ;enable anti-aliasing
	glEnable_(#GL_POINT_SMOOTH);
	glHint_(#GL_POINT_SMOOTH_HINT, #GL_NICEST);

	glEnable_(#GL_BLEND);
	glBlendFunc_(#GL_SRC_ALPHA, #GL_ONE_MINUS_SRC_ALPHA);


  ratio.f = width / height

		glClear_(#GL_COLOR_BUFFER_BIT);

		glMatrixMode_(#GL_PROJECTION);
		glLoadIdentity_();

		;Orthographic Projection
		glOrtho_(-1, 1, -1, 1, 1, -1);
		;glOrtho_(-2, 2, -2, 2, 1, -1);
		glMatrixMode_(#GL_MODELVIEW);

		glLoadIdentity_();
		glClear_(#GL_COLOR_BUFFER_BIT | #GL_DEPTH_BUFFER_BIT);

		drawPointsDemo();

EndProcedure

SetActiveGadget(0)
Repeat

Repeat
  event = WindowEvent()

    If event = #PB_Event_CloseWindow
      quit = #True
    EndIf
    key = GetGadgetAttribute(0,#PB_OpenGL_Key )
    If key = #PB_Shortcut_Escape ;  Esc key to exit
      quit = #True
    EndIf

  Until event = 0 Or quit = #True
  render()
  SetGadgetAttribute(0, #PB_OpenGL_FlipBuffers, #True)
  Delay(10)
Until Event = #PB_Event_CloseWindow Or quit = #True
the original data format like this in "data_ecg.h file":
float data_ecg[]={0.396568808f, 0.372911844f,...up to 1 MB numbers);
here i have used this way:
IncludeFile "data_ecg.pbi"
For i=0 To 65770
Read.f data_ecg(i)
Next i
the file "data_ecg.pbi" :
DataSection
Data.f 0.396568808, 0.372911844,....,up to 1 MB numbers
EndDataSection
other ways or ideas to load this big data ??, thanks a lot
download the PBI for the ecg data from here:
http://s000.tinyupload.com/?file_id=125 ... 1685324832
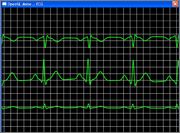
note also that the lines here have a Nice property using these codes:
Code: Select all
glEnable_(#GL_LINE_SMOOTH);
	glHint_(#GL_LINE_SMOOTH_HINT, #GL_NICEST);
	glEnable_(#GL_BLEND);
	glBlendFunc_(#GL_SRC_ALPHA, #GL_ONE_MINUS_SRC_ALPHA);
Code: Select all
IncludeFile "data_ecg.pbi"
ExamineDesktops()
Global ECG_DATA_BUFFER_SIZE =  1024
Global widthS.f = 640*1
Global heightS.f = 480
Global ratio.f = widthS / heightS
Global Dim data_ecg.f(65770)

;basic structure for a Vertex to simplify data passing
Structure vertex
  x.f ; x position
  y.f
  z.f
  r.f ; red color
  g.f
  b.f
  a.f ; alpha

EndStructure

;structure for data stream
Structure dataxyz
	x.f: y.f: z.f
EndStructure

Global v1.vertex
Global v2.vertex

;Draw a line segment on screen

Procedure drawLineSegment(*v1.vertex, *v2.vertex, width.f)
	glLineWidth_(width);
	glBegin_(#GL_LINES);
	glColor4f_(*v1\r, *v1\g, *v1\b, *v1\a);
	glVertex3f_(*v1\x, *v1\y, *v1\z);
	glColor4f_(*v2\r, *v2\g, *v2\b, *v2\a);
	glVertex3f_(*v2\x, *v2\y, *v2\z);
	glEnd_();
EndProcedure


;Draw a grid For visualization drawGrid(5.0, 1.0, 0.1);
Procedure drawGrid(width.f, height.f, grid_width.f)

  ;horizontal lines
  ;For(float i=-height; i<height; i+=grid_width){
   i.f = -height
   While i < height
     ;Vertex v1 = {-width, i, 0.0f, 1.0f, 1.0f, 1.0f, 1.0f};
     v1\x = -width: v1\y= i : v1\z = 0
	   v1\r=1 : v1\g=1: v1\b =1 : v1\a = 1
	   ;Vertex v2 = {width, i, 0.0f, 1.0f, 1.0f, 1.0f, 1.0f};
	   v2\x = width: v2\y= i : v2\z = 0
	   v2\r=1 : v2\g=1: v2\b =1 : v2\a = 1

		drawLineSegment(@v1, @v2, 1)                             ;
		i + grid_width
	Wend

	;vertical lines
	;for(float i=-width; i<width; i+=grid_width){
	i.f = -width
   While i < width
     ;Vertex v1 = {i, -height, 0.0f, 1.0f, 1.0f, 1.0f, 1.0f};
     v1\x = i: v1\y= -height : v1\z = 0
	   v1\r=1 : v1\g=1: v1\b =1 : v1\a = 1
	   ;Vertex v2 = {i, height, 0.0f, 1.0f, 1.0f, 1.0f, 1.0f};
	   v2\x = i: v2\y= height : v2\z = 0
	   v2\r=1 : v2\g=1: v2\b =1 : v2\a = 1

		drawLineSegment(@v1, @v2, 1)                             ;
		i + grid_width
	Wend


	EndProcedure

;Plot the Data from the data_ecg dataset.plotECGData(counter, data_size, -0.5, 0.1);
 Procedure plotECGData(offset.i, size.i, offset_y.f, scale.f)
  ;space between samples
   space.f = 2.0/size*ratio
   ;initial position of the first vertex To render
	pos.f = -size*space/2.0;

	;set the width of the line
	glLineWidth_(3.0);

	glBegin_(#GL_LINE_STRIP);

	;set the color of the line To green
	glColor4f_(0.1, 1.0, 0.1, 0.8);
	i=offset
	For i = offset To size+offset
	;While i < size+offset

	    DataY.f = scale*data_ecg(i)+offset_y;

		glVertex3f_(pos, DataY, 0.0);
		pos + space;

  ;i+1
  Next
glEnd_();


EndProcedure


Define event, quit

;OpenWindow(0, 0, 0, DesktopWidth(0), DesktopHeight(0), "OpenGL demo .. Big Points ", #PB_Window_BorderLess )
OpenWindow(0, 0, 0, widthS, heightS, "OpenGL demo .. ECG ")
SetWindowColor(0, RGB(200,220,200))
OpenGLGadget(0, 0, 0, widthS , heightS, #PB_OpenGL_Keyboard )

Procedure ecg_demo(counter.i)
    data_size = ECG_DATA_BUFFER_SIZE;

    ;Emulate the presence of multiple ECG leads (just For demo/display purposes)
    plotECGData(counter, data_size, -0.5, 0.1);
    plotECGData(counter+data_size, data_size, 0.0, 0.5);
    plotECGData(counter+data_size*2, data_size, 0.5, -0.25);
EndProcedure

Procedure Render()

  ;enable anti-aliasing
	glEnable_(#GL_LINE_SMOOTH);
	glHint_(#GL_LINE_SMOOTH_HINT, #GL_NICEST);
	glEnable_(#GL_POINT_SMOOTH);
	glHint_(#GL_POINT_SMOOTH_HINT, #GL_NICEST);
	glEnable_(#GL_BLEND);
	glBlendFunc_(#GL_SRC_ALPHA, #GL_ONE_MINUS_SRC_ALPHA);


		glViewport_(0, 0, widthS, heightS);
		glClear_(#GL_COLOR_BUFFER_BIT);

		glMatrixMode_(#GL_PROJECTION);
		glLoadIdentity_();

		;Orthographic Projection
    glOrtho_(-ratio, ratio, -1, 1, 1, -1);
		glMatrixMode_(#GL_MODELVIEW);

		glLoadIdentity_();
		glClear_(#GL_COLOR_BUFFER_BIT | #GL_DEPTH_BUFFER_BIT);

		;simple grid
		drawGrid(5.0, 1.0, 0.1);
		;reset counter To 0 after reaching the End of the sample Data
		If counter>5000: counter = 0: EndIf
		counter + 5
		ecg_demo(counter)

EndProcedure


For i=0 To 65770
Read.f data_ecg(i)
Next i

SetActiveGadget(0)
Repeat

Repeat
  event = WindowEvent()

    If event = #PB_Event_CloseWindow
      quit = #True
    EndIf
    key = GetGadgetAttribute(0,#PB_OpenGL_Key )
    If key = #PB_Shortcut_Escape ;  Esc key to exit
      quit = #True
    EndIf

  Until event = 0 Or quit = #True
  render()
  SetGadgetAttribute(0, #PB_OpenGL_FlipBuffers, #True)
  Delay(1)
Until Event = #PB_Event_CloseWindow Or quit = #True
