
Cet include que nous propose Uwe Keller sur le forum anglophone permet de visualiser une représentation graphique de vos données.
Source : http://www.purebasic.fr/english/viewtop ... 62#p442462
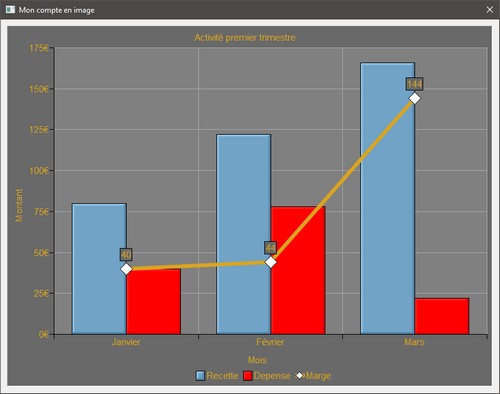
Il manque une représentation horizontale des données mais c'est un code intéressant, facile à comprendre et surtout à utiliser.
Les fonctionnalités publiques.
■ ChartGadget(Gadget, x, y, w, h, Flags=0) - Création du gadget.
. Paramètres
Flags #ChartFlagBorder - Afficher une bordure autour du graphique.
Flags #ChartFlagLegendBottom - Afficher une légende en bas du graphique.
Flags #ChartFlagYAxis - Afficher l'axe vertical
Flags #ChartFlagXAxis - Afficher l'axe horizontal
Flags #ChartFlagHGrid - Afficher les lignes horizontales de la grille
Flags #ChartFlagVGrid - Afficher les lignes verticales de la grille
■ ChartPaint(Gadget) - Dessiner le gadget.
■ ChartSet(Gadget, Setting, Value) - Change un attribut visuel
. Paramètres
Flags #ChartSetFont - Définir la police de caractères à utiliser.
Flags #ChartSetBackColor - Définir la couleur d’arrière plan du gadget.
Flags #ChartSetFrontColor - Définir la couleur de la police de caractères.
Flags #ChartSetAreaColor - Définir la couleur d’arrière plan du graphique.
Flags #ChartSetGridColor - Définir la couleur de la grille d’arrière plan.
Flags #ChartSetValueColor - Définir la couleur d'arriere plan des valeurs afficher.
Flags #ChartSetLineWidth - Définir l'épaisseur d'une ligne.
Flags #ChartSetPointSize - Définir la taille des points.
Flags #ChartSetPadding - Définir la marge intérieur du graphique.
Flags #ChartSetDecimalPlaces - ?.
Flags #ChartSetFillStyle - Définir le style de l'histogramme.
#ChartFillStyleSolid
#ChartFillStyleEmbossed
#ChartFillStyleGradient
. Exemples :
ChartSet(0, #ChartSetFont, FontID(LoadFont(#PB_Any, "", 11))) Police de caractère à utiliser.
ChartSet(0, #ChartSetFrontColor, RGB(218, 165, 32)) Changer la couleur de la police de caractère.
ChartSet(0, #ChartSetFillStyle, #ChartFillStyleGradient) Obtenir un effet dégradé.
■ ChartText(Gadget, Type, Text.s) - Créer un titre pour le graphique, les axes x et y ainsi que l'unité de mesure à utiliser.
. Exemples
ChartText(0, #ChartTextXAxis, "Mois")
ChartText(0, #ChartTextYAxis, "Montant")
ChartText(0, #ChartTextUnit, "€")
■ ChartColumn(Gadget, Name.s) - Créer une colonne
■ ChartRow(Gadget, Name.s, Type.b, Color.l, Flags=0) - Créer une rangée et définir la couleur de cette rangée.
. Paramétres
Type #ChartRowTypeBar Représentation verticale.
Type #ChartRowTypeLine Représentation linéaire.
Flags #ChartRowFlagValues Affichage d'une valeur.
■ ChartValue(Gadget, Row.s, Column.s, Value.f, Flags=0) - Ajoute une valeur à une cellule x et y
. Paramétres
Flags #ChartValueFlagReplace - Remplacer une valeur existante.
Flags #ChartValueFlagSum - Additionner une valeur à une valeur existante.
■ ChartClear(Gadget, Flags=0) - Supprimer toutes les données d'un graphique
. Paramétres
Flags #ChartClearKeepColumns - Garder la structure des colonnes.
Flags #ChartClearKeepRows - Garder la structure des rangées.
PS : Je n'ai pas testé cette dernière fonctionnalité.
Iinclude : ChartGadget.pbi
Code : Tout sélectionner
;ChartGadget written by Uwe Keller in April 2014
EnableExplicit
Macro Section
;this macro is just for code folding and indentation
EndMacro
Macro EndSection
EndMacro
Macro Iter(Object, ListOrMap)
ListOrMap
Object=ListOrMap
EndMacro
Macro Max(a, b)
((a) * Bool((a) >=(b)) + (b) * Bool((b) > (a)))
EndMacro
Macro Min(a, b)
((a) * Bool((a) <=(b)) + (b) * Bool((b) < (a)))
EndMacro
Macro New(Object)
AllocateMemory(SizeOf(Object))
EndMacro
Procedure.l ChangeColor(Color.l, Offset.l)
Protected i, a.a
;split color
For i = 0 To 2
a = PeekA(@color + i)
If a + Offset < 0
a = 0
ElseIf a + Offset > 255
a = 255
Else
a + Offset
EndIf
PokeA(@color + i, a)
Next
;return new color
ProcedureReturn Color
EndProcedure
Enumeration ;flags
#ChartFlagBorder = 1
#ChartFlagLegendRight = 2
#ChartFlagLegendBottom = 4
#ChartFlagXAxis = 8
#ChartFlagYAxis = 16
#ChartFlagHGrid = 32
#ChartFlagVGrid = 64
#ChartFlagStapled = 128
#ChartFlagBarsBorderless = 256
#ChartFlagXAxisVAlign = 512
#ChartFlagSortColumns = 1024
#ChartFlagSortRows = 2048
EndEnumeration
Enumeration ;attributes
#ChartSetFlags
#ChartSetFont
#ChartSetBackColor
#ChartSetFrontColor
#ChartSetAreaColor
#ChartSetGridColor
#ChartSetValueColor
#ChartSetAxisColor
#ChartSetLineWidth
#ChartSetPointSize
#ChartSetPadding
#ChartSetDecimalPlaces
#ChartSetFillStyle
EndEnumeration
Enumeration ;text types
#ChartTextTitle
#ChartTextYAxis
#ChartTextXAxis
#ChartTextUnit
EndEnumeration
Enumeration ;row types
#ChartRowTypeBar
#ChartRowTypeLine
EndEnumeration
Enumeration ;row flags
#ChartRowFlagValues = 1
#ChartRowFlagPoints = 2
EndEnumeration
Enumeration ;value flags
#ChartValueFlagReplace
#ChartValueFlagSum
;FEAT average
EndEnumeration
Enumeration ;fill styles
#ChartFillStyleSolid
#ChartFillStyleGradient
#ChartFillStyleEmbossed
;FEAT more fill styles
EndEnumeration
Enumeration ;clear flags
#ChartClearKeepRows = 1
#ChartClearKeepColumns = 2
EndEnumeration
Structure _ChartRow
Name.s
Type.b
Color.l
Flags.i
LastY.i
EndStructure
Structure _ChartColumn
Name.s
Minimum.f
Maximum.f
EndStructure
Structure _ChartValue
Row.s
Column.s
Value.f
EndStructure
Structure _Chart
Title.s
YTitle.s
XTitle.s
Unit.s
BackColor.l
FrontColor.l
AreaColor.l
GridColor.l
ValueColor.l
AxisColor.l
LineWidth.i
PointSize.i
Padding.i
DecimalPlaces.i
FillStyle.i
Minimum.f
Maximum.f
Flags.i
Font.i
TextHeight.i
StepValue.f
BarRowCount.i
List Rows._ChartRow()
List Columns._ChartColumn()
List Values._ChartValue()
EndStructure
Procedure.l _ChartBlendColor(Color1.l, Color2.l, Index, Count)
Protected.a r1, g1, b1, r2, g2, b2, r, g, b
;split first color
r1 = Red(Color1)
g1 = Green(Color1)
b1 = Blue(Color1)
;split second color
r2 = Red(Color2)
g2 = Green(Color2)
b2 = Blue(Color2)
;blend colors
Protected f.f = Index / Count
r = r1 + (r2 - r1) * f
g = g1 + (g2 - g1) * f
b = b1 + (b2 - b1) * f
;return new color
ProcedureReturn RGB(r, g, b)
EndProcedure
Procedure.f _ChartRoundUp(Value.f, StepValue.f)
;rounds a value to the next higher step
Protected negative, v.f
;convert negative to positive
If Value < 0
negative = #True
Value * -1
EndIf
;round value
v = Int(Value / StepValue) * StepValue
If v < Value
v + StepValue
EndIf
;restore negative value
If negative
v * -1
EndIf
;return result
ProcedureReturn v
EndProcedure
Procedure.f _ChartRoundStepValue(Value.f)
;returns a good step range value for a data point value
Protected n
;avoid errors if value is zero
If Not Value
ProcedureReturn 1
EndIf
;move value between 1 and 10
While Value > 10
Value / 10
n - 1
Wend
While Value < 1
Value * 10
n + 1
Wend
;round
Select Value
Case 1 To 2.5
Value = 2.5
Case 2.5 To 5
Value = 5
Default
Value = 10
EndSelect
;move value to original position
While n > 0
Value / 10
n - 1
Wend
While n < 0
Value * 10
n + 1
Wend
;return rounded result
ProcedureReturn Value
EndProcedure
Procedure _ChartPoint(X, Y, Radius)
;FEAT FillColor
Protected xl, xr, yt, yb, i, yo
;get corner positions
xl = x - Radius
xr = x + Radius
yt = y - Radius
yb = y + Radius
;filling
For i = Radius To 0 Step -1
yo = Radius - i
LineXY(x - i, y - yo, x + i, y - yo)
LineXY(x - i, y + yo, x + i, y + yo)
Next
;border
LineXY(xl, y, x, yt, 0)
LineXY(x, yt, xr, y, 0)
LineXY(xl, y, x, yb, 0)
LineXY(x, yb, xr, y, 0)
EndProcedure
Procedure _ChartLine(X, Y, x3, y3, Color, Thickness)
;paints a chart line with anti-aliasing
Protected.f thick, x2, y2, app, hypo, cosphi, sinphi
Protected.l color1, color2, r, g, b, r1, g1, b1
Protected signx, signy, n, nn, w, h, xp, yp
w = x3 - X
h = y3 - Y
If w >= 0
signx = 1
Else
signx = -1
w = -w
EndIf
If h >= 0
signy = 1
Else
signy = -1
h = -h
EndIf
thick.f = Thickness / 2
hypo.f = Sqr(w * w + h * h)
cosphi.f = w / hypo
sinphi.f = -Sin(ACos(cosphi))
For n = -Thickness To w + Thickness
For nn = -Thickness To h + Thickness
x2 = n * cosphi - nn * sinphi
y2 = Abs(n * sinphi + nn * cosphi)
If y2 <= thick + 0.5
app = 0.5 + thick - y2
If app > 1
app = 1
EndIf
If x2 > -1 And x2 < hypo + 1
If x2 < 0
app * (1 + x2)
ElseIf x2 > hypo
app * (1 - x2 + hypo)
EndIf
Else
app = 0
EndIf
If app > 0
xp = X + n * signx
If xp >= 0 And xp < OutputWidth()
yp = Y + nn * signy
If yp >= 0 And yp < OutputHeight()
If app >= 1
Plot(xp, yp, Color)
Else
color1 = Point(xp, yp)
r = Color & $FF
g = Color >> 8 & $FF
b = Color >> 16
r1 = color1 & $FF
g1 = color1 >> 8 & $FF
b1 = color1 >> 16
r = r * app + r1 * (1 - app)
g = g * app + g1 * (1 - app)
b = b * app + b1 * (1 - app)
color2 = RGB(r, g, b)
Plot(xp, yp, color2)
EndIf
EndIf
EndIf
EndIf
EndIf
Next
Next
EndProcedure
Procedure _ChartPaintValue(*c._Chart, X, Y, Value.f)
;paint value
Protected w, h, s.s
;get value string
s = StrF(Value, *c\DecimalPlaces)
;coordinates
w = TextWidth(s)
h = *c\TextHeight
X - w / 2
Y - *c\TextHeight / 2
;draw
DrawText(X, Y, s, *c\FrontColor, *c\ValueColor)
DrawingMode(#PB_2DDrawing_Outlined)
X - 1: Y - 1: w + 2: h + 2
Box(X, Y, w, h, *c\ValueColor)
X - 1: Y - 1: w + 2: h + 2
Box(X, Y, w, h, 0)
DrawingMode(#PB_2DDrawing_Default)
EndProcedure
Procedure _ChartPaintBar(*c._Chart, *r._ChartRow, x, y, w, h)
Protected i, c1.l, c2.l
;rotate coordinates if hight is negative (to avoid further problems when painting)
If h < 0
y + h
h * -1
EndIf
;paint bar
Select *c\FillStyle
Case #ChartFillStyleSolid
Box(x, y, w, h, *r\Color)
Case #ChartFillStyleGradient
c1 = ChangeColor(*r\Color, $50)
For i = 0 To w / 2
c2 = _ChartBlendColor(*r\Color, c1, i, w / 2)
Line(x + i, y, 1, h, c2)
Line(x + w - 1 - i, y, 1, h, c2)
Next
Case #ChartFillStyleEmbossed
Box(x, y, w, h, *r\Color)
For i = 1 To 4
c1 = ChangeColor(*r\Color, 50 - i * 10) ;light
c2 = ChangeColor(*r\Color, -50 + i * 10) ;dark
Line(x + i, y + i, w - 1 - i * 2, 1, c1)
Line(x + i, y + i, 1, h - 1 - i * 2, c1)
Line(x + w - i, y + i, 1, h - i * 2, c2)
Line(x + i, y + h - i, w - i * 2 + 1, 1, c2)
Next
EndSelect
;paint bar borders
If Not *c\Flags & #ChartFlagBarsBorderless
Line(x, y, 1, h, 0)
Line(x, y, w, 1, 0)
Line(x + w, y, 1, h, 0)
Line(x, y + h, w + 1, 1, 0)
EndIf
EndProcedure
Procedure _ChartPaintLegend(*c._Chart, *r._ChartRow, x, y)
;paint legend item
Protected i, cx, cy, ps
Select *r\Type
Case #ChartRowTypeBar
_ChartPaintBar(*c, *r, x + 1, y + 1, *c\TextHeight - 3, *c\TextHeight - 2)
Case #ChartRowTypeLine
cy = y + *c\TextHeight / 2
_ChartLine(x + 1, cy, x + *c\TextHeight - 2, cy, *r\Color, *c\LineWidth)
;limit pointsize to textsize
cx = x + *c\TextHeight / 2 - 1
ps = Min(*c\PointSize, *c\TextHeight / 2 - 2)
_ChartPoint(cx, cy, ps)
EndSelect
;row name
DrawText(x + *c\TextHeight + 1, y, *r\Name, *c\FrontColor, *c\BackColor)
EndProcedure
Procedure ChartPaint(Gadget)
;paint the whole chart
Protected *g._Chart, *c._ChartColumn, *r._ChartRow, *v._ChartValue
Protected x, y, w, h, font, xah, yaw, areah, splits, v.f, x1, y1, cw.f, i, xr, s.s, tw, cx, bw, zypos, zyneg, zy, bx, vh, px, py, lx, ly, lw, pass
#_ChartAxisLimiterLength = 8
#_ChartLegendPad = 8
#_ChartXAxisPad = 4
*g = GetGadgetData(Gadget)
With *g
StartDrawing(CanvasOutput(Gadget))
;preparation
Section
;drawing area size
w = OutputWidth()
h = OutputHeight()
;create and measure font
DrawingFont(\Font)
\TextHeight = TextHeight("Xg")
;paint background
Box(x, y, w, h, \BackColor)
;add padding
If \Padding
x + \Padding
y + \Padding
w - \Padding * 2
h - \Padding * 2
EndIf
EndSection
;paint top title
Section
If \Title
tw = TextWidth(\Title)
DrawText((w - tw) / 2, y, \Title, \FrontColor, \BackColor)
y + \TextHeight + \Padding
h - \TextHeight - \Padding
ElseIf \Flags & #ChartFlagYAxis
;at least use half height of text as spacing for y-axis values
y + \TextHeight / 2
h - \TextHeight / 2
EndIf
EndSection
;paint legend
Section
If \Flags & #ChartFlagLegendRight
;maximum row name width
ly = y + h / 2
ForEach Iter(*r, \Rows())
tw = TextWidth(*r\Name)
If tw > lw
lw = tw
EndIf
ly - (\TextHeight + #_ChartLegendPad) / 2
Next
tw + \TextHeight
lx = x + w - tw
ForEach Iter(*r, \Rows())
_ChartPaintLegend(*g, *r, lx, ly)
ly + \TextHeight + #_ChartLegendPad
Next
w - tw - \Padding
ElseIf \Flags & #ChartFlagLegendBottom
;get total width
ly = y + h - \TextHeight - \Padding
lx = x + w / 2
ForEach Iter(*r, \Rows())
;#_ChartLegendPad = 8
lx - (TextWidth(*r\Name) + \TextHeight - #_ChartLegendPad) / 2
Next
ForEach Iter(*r, \Rows())
tw = TextWidth(*r\Name)
_ChartPaintLegend(*g, *r, lx, ly + \Padding)
lx + tw + \TextHeight + #_ChartLegendPad
Next
h - \TextHeight - \Padding
EndIf
EndSection
;left title of y-axis
Section
If \YTitle
tw = TextWidth(\YTitle)
DrawRotatedText(x, y + (h + tw) / 2, \YTitle, 90, \FrontColor)
x + \TextHeight + \Padding
w - \TextHeight - \Padding
EndIf
EndSection
;bottom title of x-axis
Section
If \XTitle
tw = TextWidth(\XTitle)
DrawText(x + (w - tw) / 2, y + h - \TextHeight, \XTitle, \FrontColor, \BackColor)
h - \TextHeight - \Padding
EndIf
EndSection
;x-axis height
Section
If \Flags & #ChartFlagXAxis
xah = #_ChartAxisLimiterLength
If \Flags & #ChartFlagXAxisVAlign
ForEach \Columns()
xah = Max(xah, TextWidth(\Columns()\Name))
Next
Else
xah = Max(xah, \TextHeight)
EndIf
;add small gap between
xah + #_ChartXAxisPad * 2
;reduce remain space for area
h - xah
EndIf
EndSection
;value range
Section
If h > 0
;get value range for each column
ForEach Iter(*c, \Columns())
*c\Minimum = 0
*c\Maximum = 0
ForEach Iter(*v, \Values())
If *v\Column = *c\Name
;get sum of stapled bars
If \Flags & #ChartFlagStapled
ForEach Iter(*r, \Rows())
If *r\Name = *v\Row
If *r\Type = #ChartRowTypeBar
If *v\Value > 0
*c\Maximum + *v\Value
Else
*c\Minimum + *v\Value
EndIf
EndIf
Break
EndIf
Next
EndIf
;not stapled rows
If *v\Value < *c\Minimum
*c\Minimum = *v\Value
ElseIf *v\Value > *c\Maximum
*c\Maximum = *v\Value
EndIf
EndIf
Next
Next
;calculate min/max for chart (over all columns)
\Minimum = 0
\Maximum = 0
ForEach Iter(*c, \Columns())
If *c\Minimum < \Minimum
\Minimum = *c\Minimum
EndIf
If *c\Maximum > \Maximum
\Maximum = *c\Maximum
EndIf
Next
;widen range to avoid later errors (division by 0)
If \Maximum = \Minimum
\Maximum + 1
EndIf
;number of splits
Select h
Case 0 To 50
splits = 1
Case 0 To 100
splits = 2
Case 100 To 500
splits = 5
Default
splits = 10
EndSelect
;calculate and round step value
\StepValue = (\Maximum - \Minimum) / splits
\StepValue = _ChartRoundStepValue(\StepValue)
;round min/max
\Minimum = _ChartRoundUp(\Minimum, \StepValue)
\Maximum = _ChartRoundUp(\Maximum, \StepValue)
EndIf
EndSection
;y-axis width
Section
If \Flags & #ChartFlagYAxis
yaw = TextWidth(StrF(\Maximum, \DecimalPlaces) + \Unit)
tw = TextWidth(StrF(\Minimum, \DecimalPlaces) + \Unit)
If tw > yaw
yaw = tw
EndIf
yaw + #_ChartAxisLimiterLength
x + yaw
w - yaw
EndIf
EndSection
;paint area
Section
If h > 0
;background
Box(x, y, w, h, \AreaColor)
;paint horizontal grid of x-axis
If \Flags & #ChartFlagHGrid
v = \Minimum
While v <= \Maximum
y1 = y + h - h * (v - \Minimum) / (\Maximum - \Minimum)
Line(x, y1, w, 1, \GridColor)
v + \StepValue
Wend
EndIf
;paint vertical grid of y-axis
If \Flags & #ChartFlagVGrid
cw = w / ListSize(\Columns())
Line(x, y, 1, h, \GridColor)
ForEach \Columns()
i + 1
x1 = x + cw * i
Line(x1, y, 1, h, \GridColor)
Next
EndIf
;black line at zero position
y1 = y + h - h * -\Minimum / (\Maximum - \Minimum)
If y1 >= y And y1 <= y + h
Line(x, y1, w + 1, 1, \AxisColor)
EndIf
EndIf
EndSection
;paint values
Section
If FirstElement(\Values())
;reset last y-positions per row (for line chart)
ForEach \Rows()
\Rows()\LastY = 0
Next
;single column width
#Gap = 0.125
cw = w / ListSize(\Columns())
;single bar width
bw = cw * (1 - #Gap - #Gap)
;share width of bars if not stapled
If Not \Flags & #ChartFlagStapled And \BarRowCount > 1
bw / \BarRowCount
EndIf
;paint bars then lines
For pass = 1 To 3
ForEach Iter(*c, \Columns())
;column x-position
cx = x + ListIndex(\Columns()) * cw
;zero line y-position
zypos = y + h - h * -\Minimum / (\Maximum - \Minimum)
zyneg = zypos
bx = cx + cw * #Gap
ForEach Iter(*r, \Rows())
ForEach Iter(*v, \Values())
If *v\Row = *r\Name And *v\Column = *c\Name
vh = h * *v\Value / (\Maximum - \Minimum)
If pass = 1 And *r\Type = #ChartRowTypeBar
Section ;paint bars in first pass
;positive values above zero line, negatives below
If *v\Value > 0 Or Not \Flags & #ChartFlagStapled
zy = zypos
Else
zy = zyneg
EndIf
;paint bar
_ChartPaintBar(*g, *r, bx, zy - vh, bw, vh)
;paint value
If *r\Flags & #ChartRowFlagValues
_ChartPaintValue(*g, bx + bw / 2, zy - vh / 2, *v\Value)
EndIf
;shift to next bar position
If Not \Flags & #ChartFlagStapled
bx + bw ;next is right
ElseIf *v\Value > 0
zypos - vh ;next positve value is above
Else
zyneg - vh ;next negative value is below
EndIf
EndSection
ElseIf *r\Type = #ChartRowTypeLine
;value point position
px = cx + cw / 2
py = zypos - vh
If pass = 2
Section ;paint lines in second pass
;line is possible from the second value
If \Rows()\LastY
_ChartLine(px - cw, *r\LastY, px, py, *r\Color, \LineWidth)
EndIf
;remember this y-position so a line can be drawn next
*r\LastY = py
EndSection
ElseIf pass = 3
Section ;paint data points and values in third pass
_ChartPoint(px, py, \PointSize)
;paint value
If *r\Flags & #ChartRowFlagValues
If *v\Value >= 0
;positiv above line
py - \PointSize - \TextHeight + 4
Else
;negative below line
py + \PointSize + \TextHeight - 4
EndIf
_ChartPaintValue(*g, px, py, *v\Value)
EndIf
EndSection
EndIf
EndIf
EndIf
Next
Next
Next
Next
EndIf
EndSection
;paint y-axis
Section
If \Flags & #ChartFlagYAxis
;vertical line
Line(x, y, 1, h, \AxisColor)
;delimiters and values
v = \Minimum
While v <= \Maximum
y1 = y + h - h * (v - \Minimum) / (\Maximum - \Minimum)
Line(x - #_ChartAxisLimiterLength + 1, y1, #_ChartAxisLimiterLength, 1, \AxisColor)
s = StrF(v, \DecimalPlaces) + \Unit
DrawText(x - #_ChartAxisLimiterLength - TextWidth(s), y1 - \TextHeight / 2, s, \FrontColor, \BackColor)
v + \StepValue
Wend
EndIf
EndSection
;paint x-axis
Section
If \Flags & #ChartFlagXAxis
y + h
cw = w / ListSize(\Columns())
Line(x, y, w + 1, 1, \AxisColor)
Line(x, y, 1, #_ChartAxisLimiterLength, \AxisColor)
i = 0
ForEach Iter(*c, \Columns())
i + 1
xr = x + cw * i
Line(xr, y, 1, #_ChartAxisLimiterLength, \AxisColor)
If \Flags & #ChartFlagXAxisVAlign
DrawRotatedText(xr - (cw + \TextHeight) / 2, y + xah - #_ChartXAxisPad, *c\Name, 90, \FrontColor)
Else
tw = TextWidth(*c\Name)
DrawRotatedText(xr - cw / 2 - tw / 2, y + #_ChartXAxisPad, *c\Name, 0, \FrontColor)
EndIf
Next
EndIf
EndSection
StopDrawing()
EndWith
EndProcedure
Procedure ChartSet(Gadget, Setting, Value)
;setup chart attributes
Protected *g._Chart = GetGadgetData(Gadget)
Select Setting
Case #ChartSetFlags
*g\Flags = Value
Case #ChartSetFont
*g\Font = Value
Case #ChartSetBackColor
*g\BackColor = Value
Case #ChartSetFrontColor
*g\FrontColor = Value
Case #ChartSetAreaColor
*g\AreaColor = Value
Case #ChartSetGridColor
*g\GridColor = Value
Case #ChartSetValueColor
*g\ValueColor = Value
Case #ChartSetLineWidth
*g\LineWidth = Value
Case #ChartSetPointSize
*g\PointSize = Value
Case #ChartSetPadding
*g\Padding = Value
Case #ChartSetDecimalPlaces
*g\DecimalPlaces = Value
Case #ChartSetFillStyle
*g\FillStyle = Value
EndSelect
EndProcedure
Procedure ChartRow(Gadget, Name.s, Type.b, Color.l, Flags=0)
;add a row to the chart
Protected *g._Chart, *r._ChartRow
*g = GetGadgetData(Gadget)
;insert sorted by name
If *g\Flags & #ChartFlagSortRows
ForEach *g\Rows()
If *g\Rows()\Name > Name
*r = InsertElement(*g\Rows())
Goto Set:
EndIf
Next
EndIf
*r = AddElement(*g\Rows())
Set:
*r\Name = Name
*r\Type = Type
*r\Color = Color
*r\Flags = Flags
;count number of rows with bars
If Type = #ChartRowTypeBar
*g\BarRowCount + 1
EndIf
EndProcedure
Procedure ChartColumn(Gadget, Name.s)
;add a column to the chart
Protected *g._Chart, *c._ChartColumn
*g = GetGadgetData(Gadget)
;insert sorted by name
If *g\Flags & #ChartFlagSortColumns
ForEach *g\Columns()
If *g\Columns()\Name > Name
*c = InsertElement(*g\Columns())
Goto Set
EndIf
Next
EndIf
;append new column
*c = AddElement(*g\Columns())
Set:
*c\Name = Name
EndProcedure
Procedure ChartValue(Gadget, Row.s, Column.s, Value.f, Flags=0)
;add or update chart value
Protected *g._Chart, *v._ChartValue
*g = GetGadgetData(Gadget)
;update existing value
ForEach Iter(*v, *g\Values())
If *v\Row = Row And *v\Column = Column
Select Flags
Case #ChartValueFlagReplace
*v\Value = Value
Case #ChartValueFlagSum
*v\Value + Value
EndSelect
ProcedureReturn
EndIf
Next
;add new value
*v = AddElement(*g\Values())
*v\Row = Row
*v\Column = Column
*v\Value = Value
EndProcedure
Procedure ChartText(Gadget, Type, Text.s)
Protected *c._Chart = GetGadgetData(Gadget)
Select Type
Case #ChartTextTitle
*c\Title = Text
Case #ChartTextYAxis
*c\YTitle = Text
Case #ChartTextXAxis
*c\XTitle = Text
Case #ChartTextUnit
*c\Unit = Text
EndSelect
EndProcedure
Procedure ChartClear(Gadget, Flags=0)
;remove all data from the chart
Protected *g._Chart = GetGadgetData(Gadget)
*g\BarRowCount = 0
ClearList(*g\Values())
If Not Flags & #ChartClearKeepColumns
ClearList(*g\Columns())
EndIf
If Not Flags & #ChartClearKeepRows
ClearList(*g\Rows())
EndIf
EndProcedure
Procedure ChartGadget(Gadget, x, y, w, h, Flags=0)
;create new chart gadget (from CanvasGadget)
Protected *c._Chart, canvasflag, id
If Flags & #ChartFlagBorder
canvasflag = #PB_Canvas_Border
EndIf
id = CanvasGadget(Gadget, x, y, w, h, canvasflag)
;support #PB_Any
If Gadget = #PB_Any
Gadget = id
EndIf
;create and store additional object data
*c = New(_Chart)
SetGadgetData(Gadget, *c)
NewList *c\Columns()
NewList *c\Rows()
NewList *c\Values()
;default settings
*c\Font = GetGadgetFont(#PB_Default)
*c\BackColor = $FFFFFF
*c\FrontColor = $000000
*c\AreaColor = $E0F0FF
*c\GridColor = $D0E0F0
*c\ValueColor = $8CE6F0
*c\AxisColor = $000000
*c\LineWidth = 3
*c\PointSize = 5
*c\Padding = 8
*c\Flags = Flags
;initial paint
ChartPaint(Gadget)
;return result
ProcedureReturn id
EndProcedure
DisableExplicit