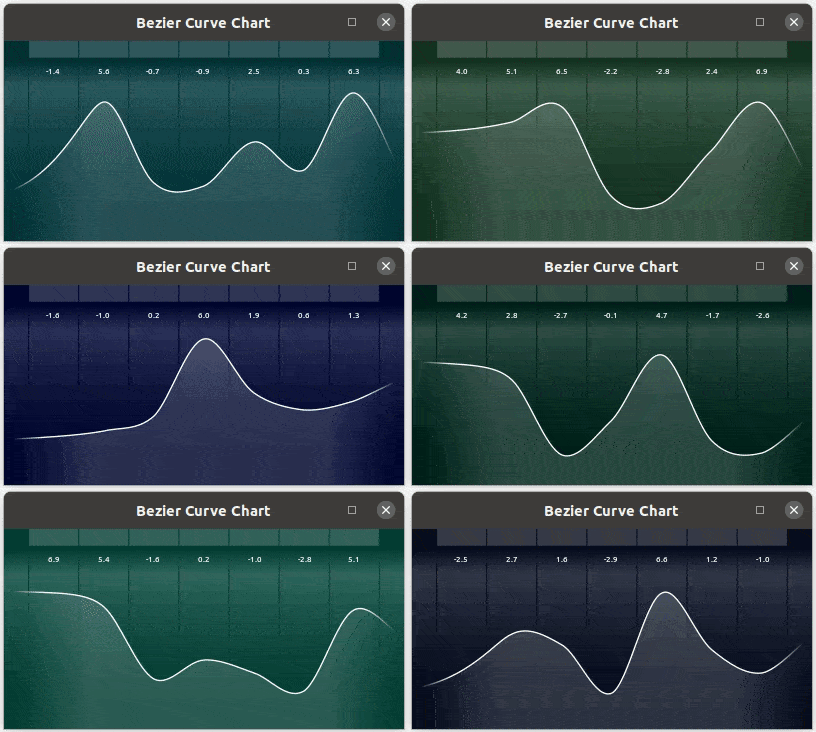
Works fine under Windows 10 and looks very nice.
I noticed that you only implemented part of Saki's suggestions. Since I don't know whether you didn't understand what he was suggesting or if you just didn't feel like it, I have modified your code as per below to work without a single global variable.
If I'm telling you something you already know, my apologies: Globals are deemed undesirable by most experienced members of the programming communities - hence a slew of new(er) languages that don't support them at all: Haskell, V etc.
Code: Select all
EnableExplicit
Structure struct_point
  x.i
  y.i
EndStructure
Declare Min_Array(Array a(1))
Declare Max_Array(Array a(1))
Declare Min(a, b)
Declare Max(a, b)
Declare Draw_Chart(gid, Array chart_data(1), in_width, in_height, bgcol = 0, frontcol = 0)
Declare.s catmullRom2bezier(Array points.struct_point(1))
; -----------------------------------------------------------------------------------------
Procedure Min_Array(Array a(1))
Protected result = a(0), i
For i = 0 To ArraySize(a()) - 1
If result >= a(i)
result = a(i)
EndIf
Next
ProcedureReturn result
EndProcedure
; -----------------------------------------------------------------------------------------
Procedure Max_Array(Array a(1))
Protected result = a(0), i
Result = a(0)
For i = 0 To ArraySize(a()) - 1
If Result <= a(i)
Result = a(i)
EndIf
Next
ProcedureReturn Result
EndProcedure
; -----------------------------------------------------------------------------------------
Procedure Min(a, b)
ProcedureReturn (a * Bool(a <= b) + b * Bool(b < a))
EndProcedure
; -----------------------------------------------------------------------------------------
Procedure Max(a, b)
ProcedureReturn (a * Bool(a >= b) + b * Bool(b > a))
EndProcedure
; -----------------------------------------------------------------------------------------
Procedure.s catmullRom2bezier(Array points.struct_point(1))
Protected out_string.s = "", i, j
For i = 0 To ArraySize(points()) - 2
Dim p.struct_point(4) ; no need for protected keyword here - new arrays are always local
If i > 0
p(0)\x = points(Max(i - 1, 0))\x
p(0)\y = points(Max(i - 1, 0))\y
Else
p(0)\x = points(i)\x
p(0)\y = points(i)\y
EndIf
p(1)\x = points(i)\x
p(1)\y = points(i)\y
p(2)\x = points(i + 1)\x
p(2)\y = points(i + 1)\y
p(3)\x = points(Min(i + 2, ArraySize(points()) - 1))\x
p(3)\y = points(Min(i + 2, ArraySize(points()) - 1))\y
; For j = 0 To ArraySize(p())-1
; Debug Str(p(j)\x) + "/" + Str(p(j)\y)
; Next
; Debug "-----------------------"
;Catmull-Rom To Cubic Bezier conversion matrix
; 0 1 0 0
;-1/6 1 1/6 0
; 0 1/6 1 -1/6
; 0 0 1 0
Dim bp.struct_point(3) ; no need for protected keyword here - new arrays are always local
bp(0)\x = (-p(0)\x + 6 * p(1)\x + p(2)\x) / 6
bp(0)\y = (-p(0)\y + 6 * p(1)\y + p(2)\y) / 6
bp(1)\x = (p(1)\x + 6 * p(2)\x - p(3)\x) / 6
bp(1)\y = (p(1)\y + 6 * p(2)\y - p(3)\y) / 6
bp(2)\x = p(2)\x
bp(2)\y = p(2)\y
FreeArray(p())
Out_String = Out_String + "C "
For j = 0 To ArraySize(bp()) - 1
Out_String = Out_String + Str(bp(j)\x) + " " + Str(bp(j)\y) + " "
Next
FreeArray(bp())
Next
ProcedureReturn out_string
EndProcedure
; -----------------------------------------------------------------------------------------
Procedure Draw_Chart(gid, Array chart_data(1), in_width, in_height, bgcol = 0, frontcol = 0)
Protected x_resolution.f, y_resolution.f, y_middle.f, text.s, x.f, y.f, i
x_resolution = in_width/ArraySize(chart_data())
y_resolution = in_height/Abs(Max_Array(chart_data()) - Min_Array(chart_data()))
y_middle = Abs(Max_Array(chart_data()) - Min_Array(chart_data())) / 2
Dim chart.struct_point(ArraySize(chart_data()))
For i = 0 To ArraySize(chart_data()) - 1
chart(i)\x = ((i + 1) * x_resolution )
chart(i)\y = (-chart_data(i) * y_resolution / 2) + 2 * in_height / 3
Next
If StartVectorDrawing(CanvasVectorOutput(gid))
ScaleCoordinates(DesktopResolutionX(), DesktopResolutionY())
AddPathBox(0, 0, in_width, in_height)
VectorSourceColor(RGBA(0, 0, 0, 255))
FillPath()
ClosePath()
For i = 0 To ArraySize(chart_data())
AddPathBox(i * (x_resolution + x_resolution/500) - x_resolution/2, in_height / 11.4, x_resolution -(x_resolution / 50), in_height)
Next
VectorSourceLinearGradient(i * (x_resolution + x_resolution/500) - x_resolution / 2, in_height / 11.4, i * (x_resolution + x_resolution / 500) - x_resolution / 2, in_height)
VectorSourceGradientColor(RGBA(0, 0, 0, 0), 0)
VectorSourceGradientColor(RGBA(255, 255, 255, 0), 0.01)
VectorSourceGradientColor(RGBA(255, 255, 255, 200), 0.15)
VectorSourceGradientColor(RGBA(0, 0, 0, 0), 0.98)
ClosePath()
FillPath()
AddPathBox(0, 0, in_width, in_height)
If bgcol = 0 : bgcol = RGBA(0, 0, 0, 255):EndIf
VectorSourceColor(bgcol)
FillPath()
ClosePath()
; Chart line
MovePathCursor(0, (-chart_data(0) * y_resolution / 2) + 2 * in_height / 3)
AddPathSegments(catmullRom2bezier(chart()))
VectorSourceLinearGradient(0, 0, in_width, 0)
VectorSourceGradientColor(RGBA(0, 0, 0, 0), 0)
VectorSourceGradientColor(RGBA(255, 255, 255, 0), 0.02)
VectorSourceGradientColor(RGBA(255, 255, 255, 255), 0.10)
VectorSourceGradientColor(RGBA(255, 255, 255, 255), 0.90)
VectorSourceGradientColor(RGBA(255, 255, 255, 0), 0.98)
VectorSourceGradientColor(RGBA(0, 0, 0, 0), 1)
StrokePath(in_height / 150)
; Chart area
MovePathCursor(in_width, in_height)
AddPathLine(0, in_height)
AddPathLine(0, (-chart_data(0) * y_resolution / 2) + 2 * in_height / 3)
AddPathSegments(catmullRom2bezier(chart()))
VectorSourceLinearGradient(0, 0, in_width, 0)
VectorSourceGradientColor(RGBA(0,0,0, 0), 0)
VectorSourceGradientColor(RGBA(255, 255, 255, 0), 0.02)
VectorSourceGradientColor(RGBA(255, 255, 255, 40), 0.20)
VectorSourceGradientColor(RGBA(255, 255, 255, 40), 0.80)
VectorSourceGradientColor(RGBA(255, 255, 255, 0), 0.98)
VectorSourceGradientColor(RGBA(0, 0, 0, 0), 1)
FillPath()
; Chart headers
For i = 1 To ArraySize(chart_data()) - 1
AddPathBox(i * (x_resolution + x_resolution / 500) - x_resolution / 2, 0, x_resolution - (x_resolution / 50), in_height / 12)
Next
VectorSourceColor(RGBA(255, 255, 255, 50))
ClosePath()
FillPath()
; Chart headers labels - to be added
; Chart values
VectorSourceColor(RGBA(255, 255, 255, 200))
VectorFont(FontID(0), x_resolution / 2.5)
For i = 1 To ArraySize(chart_data()) - 1
text = StrF(chart_data(i - 1) / 10, 1)
x = i * (x_resolution + x_resolution / 500) - x_resolution / 2
x = (x + ((x_resolution - (x_resolution / 50)) / 2)) - VectorTextWidth(text) / 2
MovePathCursor(x, in_height / 8)
DrawVectorText(text)
Next
StopVectorDrawing()
EndIf
EndProcedure
; -----------------------------------------------------------------------------------------
Procedure Resize_Window()
Protected i
Dim chart_dataset(24) ; no need for protected keyword here - new arrays are always local
For i = 0 To ArraySize(chart_dataset()) - 1
chart_dataset(i) = (Random(100, 0) - 30)
Next
ResizeGadget(0, 0, 0, WindowWidth(0), WindowHeight(0))
Draw_Chart(0, chart_dataset(), WindowWidth(0), WindowHeight(0), RGBA(Random(30, 0), Random(55, 0), Random(55, 0), Random(200, 100)))
EndProcedure
; -----------------------------------------------------------------------------------------
Procedure StartProgram()
Protected Event
If OpenWindow(0, 0, 0, 400, 200, "Bezier Curve Chart", #PB_Window_SystemMenu | #PB_Window_ScreenCentered| #PB_Window_SizeGadget| #PB_Window_MaximizeGadget)
CanvasGadget(0, 0, 0, WindowWidth(0), WindowHeight(0))
AddWindowTimer(0, 123, 1000)
LoadFont(0, "Ubuntu", 10, #PB_Font_HighQuality)
Resize_Window()
;
BindEvent(#PB_Event_SizeWindow, @Resize_Window(), 0)
BindEvent(#PB_Event_Timer, @Resize_Window(), 0)
;
Repeat
Event = WaitWindowEvent()
Until Event = #PB_Event_CloseWindow
EndIf
EndProcedure
; -----------------------------------------------------------------------------------------
StartProgram()
