Help with thirdparty C++-DLL (paid work)
Posted: Tue Aug 28, 2012 6:45 am
Hello,
I need to use the chartdirector component (C++-DLL, no dependencies; free download of a fully working trial version, comprehensive doc with samples: http://www.advsofteng.com/download.html) in my PB programs.
Could anybody help me with converting the header files, developing a wrapper and translating some of the samples into PB ?
Possibly as paid project; if interested, please contact me by PM with rates & availability.
BTW, for I think it to be very important having powerful charting capacities with PB, I would like to release above paid work results as open source.
Thank you and best regards
Oliver
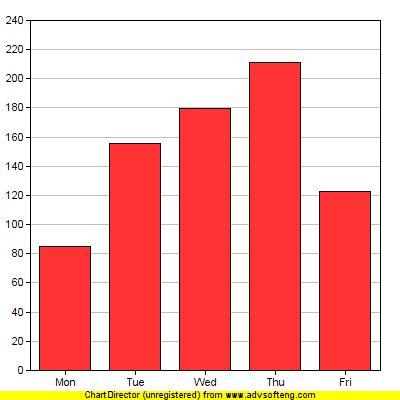
Below a sample, how to create a simple bar chart in C++. How would this look like in PB ?
And some hints to this code:
I need to use the chartdirector component (C++-DLL, no dependencies; free download of a fully working trial version, comprehensive doc with samples: http://www.advsofteng.com/download.html) in my PB programs.
Could anybody help me with converting the header files, developing a wrapper and translating some of the samples into PB ?
Possibly as paid project; if interested, please contact me by PM with rates & availability.
BTW, for I think it to be very important having powerful charting capacities with PB, I would like to release above paid work results as open source.
Thank you and best regards
Oliver
Below a sample, how to create a simple bar chart in C++. How would this look like in PB ?
Code: Select all
#include "chartdir.h"

int main(int argc, char *argv[])
{
    // The data for the bar chart
    double data[] = {85, 156, 179.5, 211, 123};

    // The labels for the bar chart
    const char *labels[] = {"Mon", "Tue", "Wed", "Thu", "Fri"};

    // Create a XYChart object of size 250 x 250 pixels
    XYChart *c = new XYChart(250, 250);

    // Set the plotarea at (30, 20) and of size 200 x 200 pixels
    c->setPlotArea(30, 20, 200, 200);

    // Add a bar chart layer using the given data
    c->addBarLayer(DoubleArray(data, sizeof(data)/sizeof(data[0])));

    // Set the labels on the x axis.
    c->xAxis()->setLabels(StringArray(labels, sizeof(labels)/sizeof(labels[0])));

    // Output the chart
    c->makeChart("simplebar.png");

    //free up resources
    delete c;
    return 0;
}
And some hints to this code:
Code: Select all
#include "chartdir.h"

To use the ChartDirector API, you just need to include the "chartdir.h" header file. This header file will in turn include other necessary header files.


XYChart *c = new XYChart(250, 250);

The first step in creating any chart in ChartDirector is to create the appropriate chart object. In this example, an XYChart object of size 250 x 250 pixels is created. In ChartDirector, XYChart represents any chart that has x-axis and y-axis, such as the bar chart we are drawing.


c->setPlotArea(30, 20, 200, 200);

The second step in creating a bar chart is to specify where should we draw the bar chart. This is by specifying the rectangle that contains the bar chart. The rectangle is specified by using the (x, y) coordinates of its top-left corner, together with its width and height.

For this simple bar chart, we will use the majority of the chart area to draw the bar chart. We will leave some margin to allow for the text labels on the axis. In the above code, the top-left corner is set to (30, 30), and both the width and height is set to 200 pixels. Since the entire chart is 250 x 250 in size, there will be 20 to 30 pixels margin for the text labels.

Note that ChartDirector uses a pixel coordinate system that is customary for computer screen. The x pixel coordinate is increasing from left to right. The y pixel coordinate is increasing from top to bottom. The origin (0, 0) is at the top-left corner.

For more complex charts which may contain titles, legend box and other things, we can use this method (and other methods) to design the exact layout of the entire chart.


c->addBarLayer(DoubleArray(data, sizeof(data)/sizeof(*data)));

The above code adds a bar layer to the XYChart. In ChartDirector, any chart type that has x-axis and y-axis is represented as a layer in the XYChart. An XYChart can contain multiple layers. This allows "combination charts" to be created easily by combining different layers on the same chart (eg., a chart containing a line layer on top of a bar layer) .

In the above line of code, the argument is an array of numbers representing the values of the data points.


c->xAxis()->setLabels(StringArray(labels, sizeof(labels)/sizeof(*labels)));

The above code sets the labels on the x-axis. The first method XYChart.xAxis retrieves the Axis object that represents the x-axis. The second method Axis.setLabels binds the text labels to the x-axis. The argument to the setLabels method is an array of text strings.


c->makeChart("simplebar.png");

Up to this point, the chart is completed. We need to output it somehow. In our simple project, we output the chart as a PNG formatted file.

For the image format, in addition to PNG, ChartDirector supports JPG, GIF, BMP and WBMP. For output methods, ChartDirector supports outputting the images as files and in memory (eg. for display on screen).