

Hi folks,
here's a little present for the Purebasic community. In the last months I worked on a profiler which serves the performance-hunter with lots of features to locate time- and instruction-consuming spots in your programs. As I needed this stuff for my own projects and it did very well I thought that it might be of use for others as well.
Purefiler's concept
The main concept I followed is that you're dealing with one program which acts in two ways:
1) as a PB-IDE-plugin that works as a pre-processor for building and
2) as a standalone program to analyze the profiling results.
However, for the second mode it's also possible to configure it as a plugin to have it available "in" the IDE.
So, if you want to profile one of your programs, and that might even be a DLL, you just have to enable the Purefiler-plugin and build the executable. Everytime your program (or DLL) gets executed it will generate profiling-information in your home-folder, ready to be analyzed in analysis-mode of Purefiler.
What is being profiled?
Purefiler in general stores an invocation-counter as well as the time (in µs) each executed instruction needed. Further both of these - the counter and the time - are correctly corelated to the according thread and - in the case of recursions - to the recursion-level (which is done by focusing the stack).
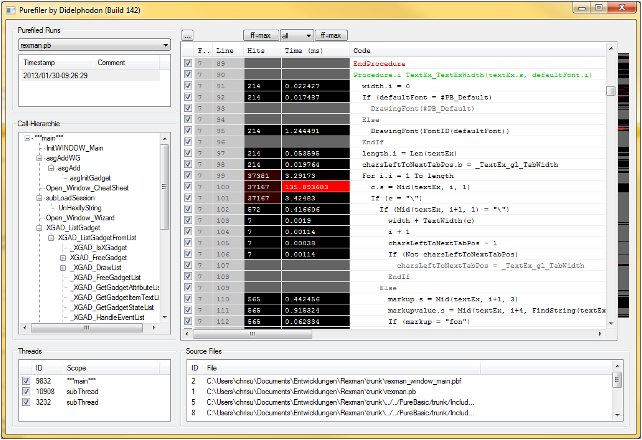
The GUI, an overview
Once you started the GUI-mode all ever stored profiles are being made available through a combination of a combobox and a listview. The combobox is used to select the source-code whose runs you like to analyze. With the listbox you select the specific run identifyable by the according timestamp.
Then the profile is being loaded. After that you'll be presented with all the runtime- and build-informations stored/monitored. The latter are an overview of the according includefiles, all the threads that have been created including there scope, the sourcecode and of course the actual profiling-data.
Analyzing-basics
Purefiler's main-focus lies in hunting the causes for bad performance. According to this I decided to follow an approach that reduces the number of (monitoring-)runs to a minimum. In other words, I've tried to get the most out of each single run. So, the idea behind the GUI is that you narrow down the area where the performance-loss happens until you locate it. How is this done?
Any instruction in the source-code that has been executed at least once can become a (what I call) "peek". A peek has a red background, otherwise it's black. Both profile-information-types, counter and time, can become peeks but they aren't necessarily linked. Further for the time you can freely choose one of 4 timing-modes: all, avg, min, max.
The checkmarks magic
With the checkboxes in the source-code-listview you decide which lines should be included in the peek-calculation. Nothing more, nothing less. By unchecking lines you can remove them from the peek-calculation letting other lines become peeks. That's for example necessary if you're dealing with instructions that are messing up a profile like requesters, delays, inputs, etc. You see, with the checkmarks you can "hunt". To optimize this kinda hunting there's a little button on the upper left of the source-code-listview with "..." as caption. This opens up a submenu which let you automatically add/remove checkmarks in various ways.
- Check all: Check every line.
- Remove all checks: Uncheck every line.
- Complete checks for scopes: The scope of any checked line is taken and all missing lines according to this scopes are being checked. (I.e.: Check all lines of one/multiple procedures).
- Add checks for a sourcefile: Lets you choose an include or the master-sourcefile to add checkmarks for the according lines.
- Add checks for a thread: Lets you choose a thread to add checkmarks for its executed lines.
- Add checks for implicitly invocations: If you have a call to a procedure which seems to be time-consuming just checkmark the call and then by using this tool all implicitly invoked instructions "behind" it are checkmarked automatically.
- Remove checks for a sourcefile: Lets you choose an include or the master-sourcefile to remove the checkmarks for the according lines.
- Remove checks for a thread: Lets you choose a thread to remove the checkmarks for it's executed lines.
- Remove checks for implicitly invocations: If you have a call to a procedure which seems to be time-consuming just un-checkmark the call and then by using this tool all implicitly invoked instructions "behind" it are un-checkmarked automatically.
This let you choose all threads that shall be included in the peek-calculation.
Manually peeking
If you need to customize the peek-visualization you can set the values which are responsible for full-bright-red. To return to automatic just choose 0 (zero).
The birds view
The birds view is the vertical rectangluar area on the right side. It shows you an overview of your whole source-code regarding to calculated peeks. A left-click with the mouse on a specific point in it brings you to the correlating location.
Configuration for PB-IDE
As already mentioned you need one plugin working as preprocessor. While I understand "commandline" as selfexplanatory the proper configuation-string for "Arguments" is "%FILE" "%COMPILEFILE". Choose "Before Create Executable" as event and check the "Wait until tool quits" and "Hide tool from the main-menu" -boxes.
The second plugin is just for calling Purefiler in analysis-mode. No special configuration is needed, you can actually run it from anywhere as long as it receives no arguments.
And don't forget, by enabling/disabling the first plugin you can choose if profiling should be included or not!
Ok, that's all about the usability 'bout Purefiler, though I know that I forgot a lot tell and explain, for sure.
Try it if you're interested but I understand that I have to refuse any kind of warranty and stuff
After all, here's the download-location: http://www.wojner.at/static/downloads/Purefiler.exe
EDIT: ----------------------------------------------
Build 142 - Changelog
* Call hierarchie is available now
Build 147 - Changelog
* Bugfix
* Manual overriding is available now
(";Purefiler ON", ";Purefiler OFF")
* Not used scopes are grayed out in the call-hierarchie
* Better recursion-detection for call-hierarchie
* In the call-hierarchie recursions are tagged with " (recursion)" now
Cheers, Didel.


